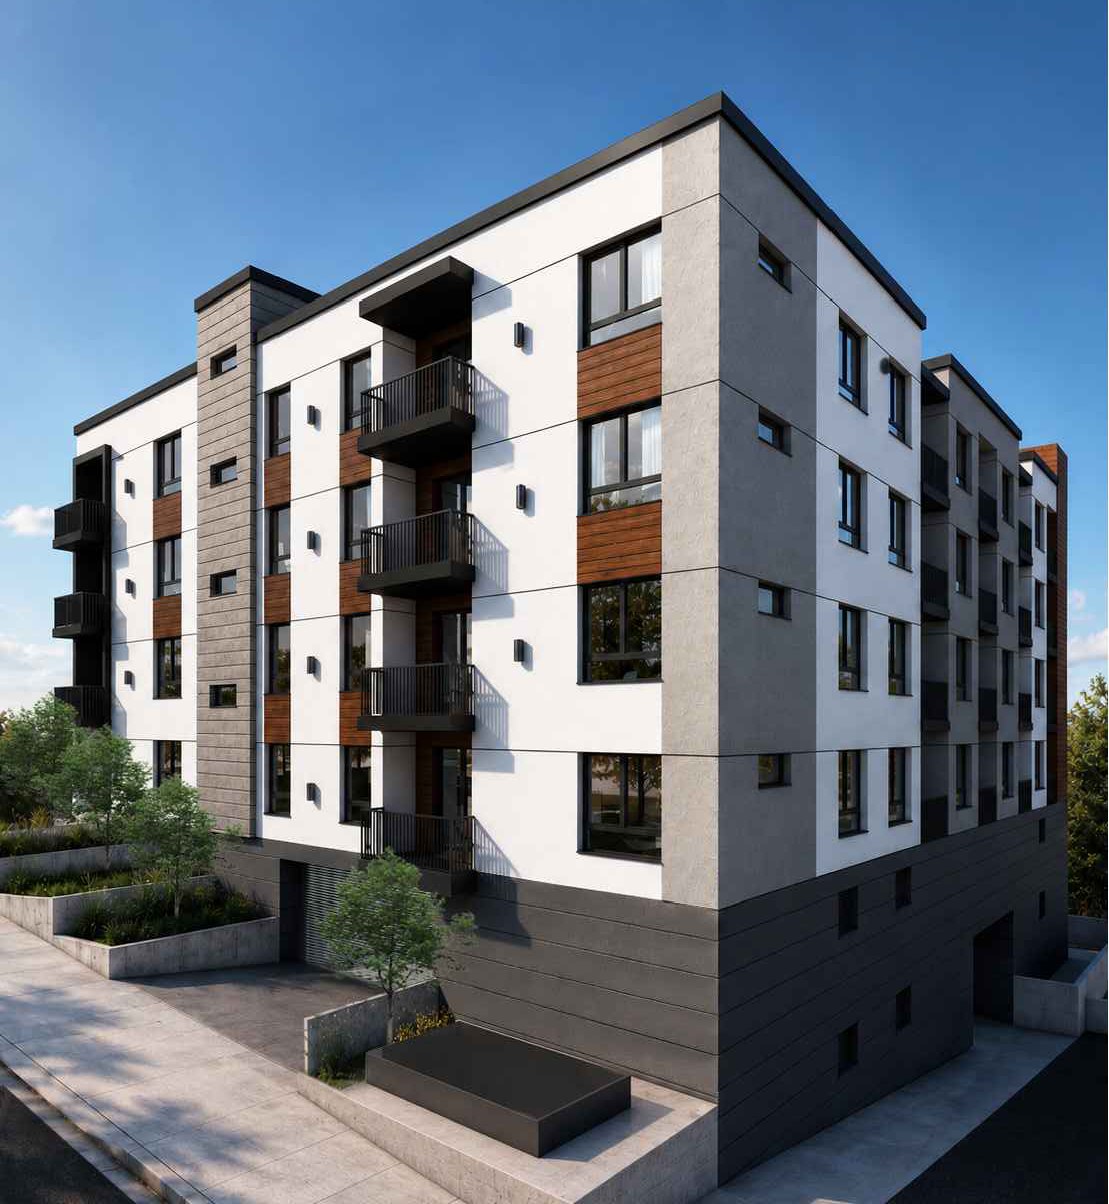
The opportunity. Echo Park is one of Los Angeles' most rent-resilient submarkets — supply-constrained, transit-rich, and consistently leased at a premium to the broader Eastside. 2126–2136 Branden offers a rare double-lot canvas in that submarket: R3-1VL zoning with a clearly marked State Density Bonus path to 39 units. An existing 6-unit RSO building generates interim holding income while a buyer runs its entitlement.
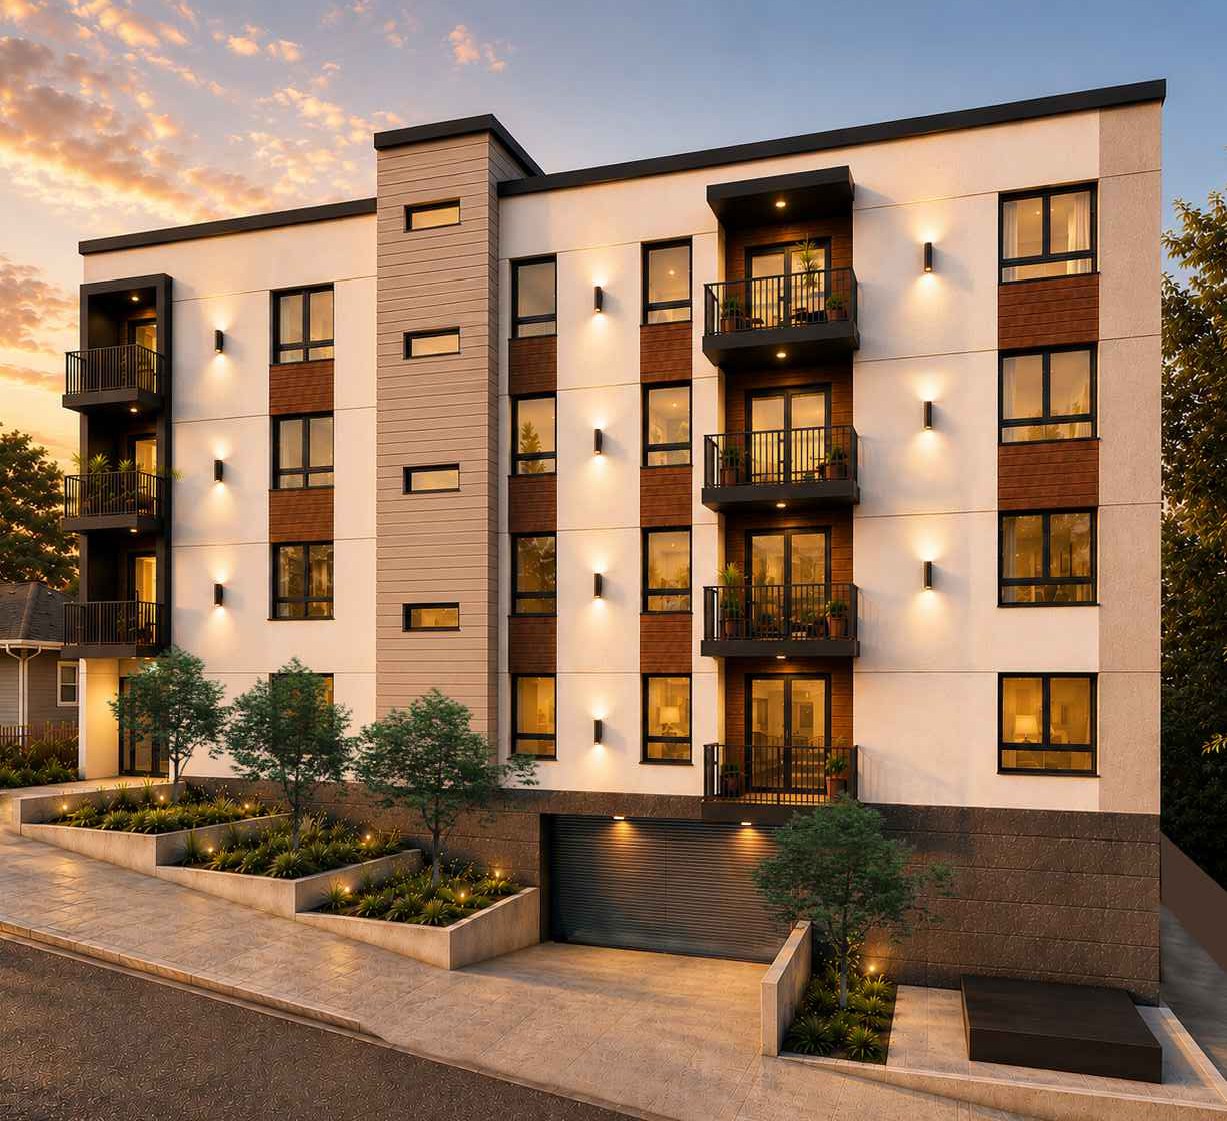
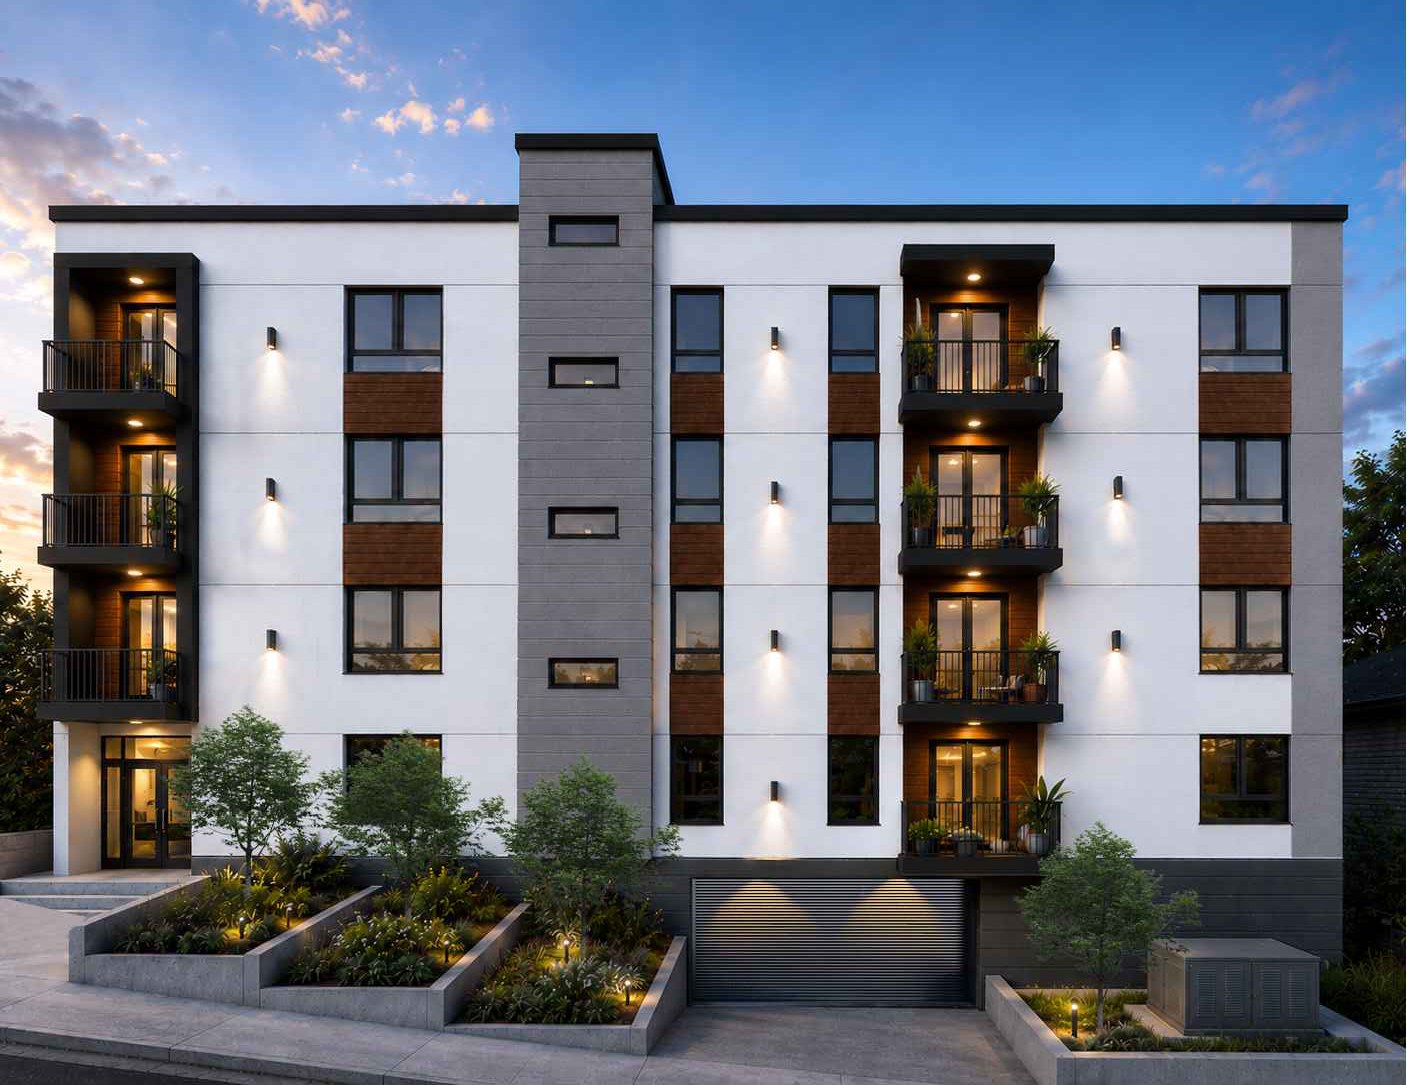
The concept. The conceptual scheme by Molai Land & Design finishes at a true institutional rental size and quality — 39 units averaging ±847 SF across a one-, two-, and three-bedroom mix, over two levels of subterranean parking. Proven newer-construction Echo Park rents within blocks of the site support the rental underwriting behind the concept.
What this document does. It establishes what a completed 39-unit rental building on this site would earn and be worth — from sourced newer-construction rent comparables — itemizes the cost to build it, and prices the land as it sits today on market land metrics and comparable land sales. Every comparable is sourced; every assumption is labeled.

Every unit, by floor, with its plan type and net area — transcribed from the conceptual plan set's per-floor “Area Per Unit” schedules. Four residential floors (2–5) sit above the ground-floor lobby and two subterranean parking levels.
| Unit | Plan Type | Net SF |
|---|---|---|
| 201 | 2 Bed / 2 Bath | 1,195 |
| 202 | 1 Bed / 1 Bath | 782 |
| 203 | 2 Bed / 2 Bath | 1,195 |
| 204 | 1 Bed / 1 Bath | 782 |
| 205 | 1 Bed / 1 Bath | 681 |
| 206 | 1 Bed / 1 Bath | 782 |
| 207 | 1 Bed / 1 Bath | 681 |
| 208 | 1 Bed / 1 Bath | 806 |
| 209 | 3 Bed / 2 Bath | 986 |
| Second Floor · 9 units | 7,890 | |
| Unit | Plan Type | Net SF |
|---|---|---|
| 301 | 1 Bed / 1 Bath | 610 |
| 302 | 2 Bed / 2 Bath | 1,161 |
| 303 | 1 Bed / 1 Bath | 782 |
| 304 | 2 Bed / 2 Bath | 1,114 |
| 305 | 1 Bed / 1 Bath | 782 |
| 306 | 1 Bed / 1 Bath | 681 |
| 307 | 1 Bed / 1 Bath | 782 |
| 308 | 1 Bed / 1 Bath | 681 |
| 309 | 1 Bed / 1 Bath | 806 |
| 310 | 3 Bed / 2 Bath | 986 |
| Third Floor · 10 units | 8,385 | |
| Unit | Plan Type | Net SF |
|---|---|---|
| 401 | 1 Bed / 1 Bath | 610 |
| 402 | 2 Bed / 2 Bath | 1,161 |
| 403 | 1 Bed / 1 Bath | 782 |
| 404 | 2 Bed / 2 Bath | 1,114 |
| 405 | 1 Bed / 1 Bath | 782 |
| 406 | 1 Bed / 1 Bath | 681 |
| 407 | 1 Bed / 1 Bath | 782 |
| 408 | 1 Bed / 1 Bath | 681 |
| 409 | 1 Bed / 1 Bath | 806 |
| 410 | 3 Bed / 2 Bath | 986 |
| Fourth Floor · 10 units | 8,385 | |
| Unit | Plan Type | Net SF |
|---|---|---|
| 501 | 1 Bed / 1 Bath | 610 |
| 502 | 2 Bed / 2 Bath | 1,161 |
| 503 | 1 Bed / 1 Bath | 782 |
| 504 | 2 Bed / 2 Bath | 1,114 |
| 505 | 1 Bed / 1 Bath | 782 |
| 506 | 1 Bed / 1 Bath | 681 |
| 507 | 1 Bed / 1 Bath | 782 |
| 508 | 1 Bed / 1 Bath | 681 |
| 509 | 1 Bed / 1 Bath | 806 |
| 510 | 3 Bed / 2 Bath | 986 |
| Fifth Floor · 10 units | 8,385 | |
Unit numbers, plan types and net areas per the “Area Per Unit” schedules on the conceptual plan set (sheet T-0). Plan types: 1-Bedroom ±610–806 SF (27 units), 2-Bedroom ±1,114–1,195 SF (8 units), 3-Bedroom 986 SF (4 units). Net residential area totals ±33,045 SF; the affordable / income-restricted units contemplated by the State Density Bonus would be drawn from this unit pool.
Source: conceptual plan set for 2126–2136 W Branden St (cover sheet, project data, area & density-bonus calculations, unit schedules) by Molai Land & Design. Areas per ZIMAS and the plan set's area summary. Offering status per Ownership; buyer to confirm all zoning, development standards, density-bonus requirements, and fees in due diligence.
A renter magnet. Echo Park has spent a decade as one of Los Angeles' most sought-after creative-class neighborhoods. Walkable to Echo Park Lake, the Sunset Blvd corridor, and Historic Filipinotown, it draws a deep, durable pool of tenants — and consistently leases at a premium to the broader Eastside.
Supply is structurally tight. Small lots, hillside topography, and rent-stabilized older stock keep new deliveries scarce. Recent newer-construction projects — Zag, Inspire, OnSunset, Echo 55, 1915 Park and Encore among them — have leased up at strong rents within blocks of the subject, evidence of demand depth rather than oversupply.
Pricing strength. As of mid-2026 Echo Park's median home price sits near $1.30–$1.35 million, and newer-construction rentals within blocks of the subject are achieving roughly $3.65–$6.35 per SF — the rent band that underpins the rental analysis in Section 04.
Sources: Redfin — Echo Park housing market; RentCafe & Zumper Echo Park / Greater Echo Park Elysian rent research. Figures current as of May 2026 and approximate.
| Property | Built | Avg SF | Asking Rent / mo | Rent / SF |
|---|---|---|---|---|
| Studio | ||||
| Encore Echo Park · 226 N Lake St | 2021 | 473 | $1,795–$1,950 | $3.96 |
| Inspire Echo Park · 355 Glendale Blvd | 2024 | 319–469 | $2,271–$2,860 | $6.35 |
| Zag Apartments · 1750 Glendale Blvd | 2022 | 550–604 | $2,195–$2,495 | $4.06 |
| 1915 Park · 1915 Park Ave | 2025 | 388–514 | $2,399–$2,714 | $5.65 |
| OnSunset · 2225 W Sunset Blvd | 2025 | 370–518 | $2,450–$2,760 | $5.85 |
| One-Bedroom | ||||
| Encore Echo Park · 226 N Lake St | 2021 | 668 | $2,500–$2,600 | $3.82 |
| Inspire Echo Park · 355 Glendale Blvd | 2024 | 523–580 | $2,900–$3,500 | $5.80 |
| Zag Apartments · 1750 Glendale Blvd | 2022 | 705 | $2,950 | $4.18 |
| 1915 Park · 1915 Park Ave | 2025 | 594–778 | $3,493–$3,659 | $5.21 |
| Echo 55 · 1655 N Allesandro St | 2025 | ±850 | $2,750–$3,200 | $3.65 |
| OnSunset · 2225 W Sunset Blvd | 2025 | 514–1,106 | $3,275–$4,300 | $5.15 |
| SUBJECT — 2126-2136 Branden · 27 units | 2029E | 737 | $3,200–$3,400 | $4.48 |
| Two-Bedroom | ||||
| Encore Echo Park · 226 N Lake St | 2021 | 816–1,208 | ≈$3,295 | ≈$3.25 |
| Inspire Echo Park · 355 Glendale Blvd | 2024 | 1,081–1,116 | $5,254–$5,354 | $4.83 |
| Zag Apartments · 1750 Glendale Blvd | 2022 | 977–1,034 | $3,495–$3,895 | $3.67 |
| 1915 Park · 1915 Park Ave | 2025 | 964–1,192 | $4,899–$5,235 | $4.70 |
| Echo 55 · 1655 N Allesandro St | 2025 | ±1,050 | $3,350–$3,950 | $3.48 |
| OnSunset · 2225 W Sunset Blvd | 2025 | 1,005–1,178 | $4,100–$5,400 | $4.35 |
| SUBJECT — 2126-2136 Branden · 8 units | 2029E | 1,152 | $4,800 | $4.17 |
| Three-Bedroom | ||||
| Inspire Echo Park · 355 Glendale Blvd | 2024 | 1,089 | $6,032–$6,182 | $5.61 |
| SUBJECT — 2126-2136 Branden · 4 units | 2029E | 986 | $6,000 | $6.09 |
Sources: Apartments.com, Zumper, RentCafe and building operator/listing pages for Encore Echo Park (226 N Lake St, 2021), Inspire Echo Park (355 Glendale Blvd, 2024), Zag Apartments (1750 Glendale Blvd, 2022), 1915 Park (1915 Park Ave, 2025), Echo 55 (1655 N Allesandro St, 2025) and OnSunset (2225 W Sunset Blvd, 2025). Rents are advertised asking rents current as of May 2026, shown for the representative unit of each type, and exclude lease-up concessions; SF is the representative net size and Rent/SF is rent ÷ SF. Several comps are in active lease-up; Encore two-bedroom figures are approximate. Subject figures are underwriting assumptions — see the note below.
Market rents per the by-type analysis above (blended ±$4.59/SF). Three very-low-income units assumed drawn from the 1BR pool.
| Exit Cap | Stabilized Value | Per Unit |
|---|---|---|
| 5.00% | $22,500,000 | $576,900 |
| 5.25% (base) | $21,430,000 | $549,500 |
| 5.50% | $20,455,000 | $524,500 |
Stabilized value = NOI ÷ cap rate. Newer Class-A apartment product in supply-constrained Eastside submarkets has traded in a roughly 4.75%–5.50% range; 5.25% is the base case.
| Project / Asset | Location | Units | Built | Situation | Guidance | $/Unit | vs. Replacement |
|---|---|---|---|---|---|---|---|
| On Market — Echo Park Portfolio (3 assets · 190 units · one seller) | |||||||
| ZAG Apartments ON MARKET | 1750 Glendale Blvd | 70 | 2022 | Canadian developer liquidating to recapitalize a Vancouver condo business; self-managed for two years, creating operational drag. Communicated price-taker targeting ±$350K/door on all three assets. Valued at a 5.50% cap on Year 1 financials. | $68,400,000 UW $62.7M |
$360,000 UW $330K |
−36.3% UW −40.0% |
| PARK Apartments ON MARKET | 200 N Toluca St | 60 | 2024 | ||||
| VISTA Apartments ON MARKET | 215 N Toluca St | 60 | 2024 | ||||
| On Market — Additional Asset | |||||||
| 1350 W Court St ON MARKET | 1350 W Court St | 70 | 2026 | Bank short sale — $3.5M of preferred equity and all common equity wiped out; sold to partially repay the senior lender. TCO in ±2 months; a full lease-up deal, valued by solving to a 5.75%–6.00% stabilized cap. No OM released yet. | $25,500,000 UW $21.0M |
$364,000 UW $300K |
−33.8% UW −45.5% |
| Potentially Coming to Market | |||||||
| Inspire Echo Park EXPECTED | 355 Glendale Blvd | 90 | 2025 | Not yet listed; per the marketing broker, both assets are expected to come to market this year if the owner elects to sell — adding ±137 more units of newer product to the pocket's supply of discounted deals. | TBD | TBD | — |
| Inspire Colton EXPECTED | 1363 Colton St | 47 | 2021 | ||||
Source: marketing broker's offering summary for the Echo Park Portfolio and related assets, and the portfolio Offering Memorandum — view the Echo Park Portfolio OM (PDF). Replacement cost of ±$550,000/unit per that broker's live GC bid data for comparable podium product. Guidance and underwriting figures are the listing broker's, current as of mid-2026 and subject to change; ZAG and Inspire also appear as rent comparables in Section 04.
| Property | Lot SF | Status at Sale | Sale Date | Price | $/Lot SF |
|---|---|---|---|---|---|
| Closed Land Sale | |||||
| 825–837 Hyperion Ave · Silver Lake | 22,570 | Entitled & RTI at close · sold to an affordable developer (Silver Lake Flats LP) requiring tax credits · 18-month escrow | 6/26/2026 | $5,277,000 | $234 |
| On Market — Active Land Listings | |||||
| 1415 W Court St · Echo Park / DTLA-adjacent · OM (PDF) | 12,040 | Vacant land on an alley · zoned CW (R4) · just south of the 101, near Echo Park and DTLA | Active | $1,900,000 | $158 |
| 1108 Manzanita St · Sunset Junction · OM (PDF) | 7,688 | 54-unit RTI, 100% affordable housing project · ±$41.6K per door · reduced from $2,995,000 | Active | $2,250,000 | $293 |
| 801–807 Waterloo St · Echo Park | 12,613 | 131-unit fully entitled 100% affordable project (ED1 ministerial) · Letter of Compliance in hand · 50% DD plan package & BOE-approved welfare exemption included · ±$23,100 per buildable unit · on market 4+ months | Active | $3,025,000 | $240 |
| SUBJECT — 2126–2136 W Branden St · Echo Park | 14,928 | Raw land · conceptual plans for 39 units · no entitlements convey | Ask | $2,500,000 | $167 |
825–837 Hyperion Ave: sale price and ownership per assessor records (buyer Silver Lake Flats LP, 214 Main St #490, El Segundo); closed 6/26/2026 at $5,277,000 on a 22,570 SF site — ±$234/lot SF with entitlements and an RTI permit in hand, to a tax-credit buyer on an 18-month close. Active listings per their brokers' offering materials (OMs linked where available); asking prices as of August 2026 and subject to change. 1415 W Court ($158/lot SF, vacant R4-equivalent) brackets the subject's $167/lot SF ask. 1108 Manzanita — a 54-unit RTI project reduced to $41.6K/door — and 801–807 Waterloo — 131 fully entitled ED1 units asking $240/lot SF after 4+ months on market — show how narrowly the market prices 100%-affordable entitled product with a restricted buyer pool. The subject's ask — a ±29% discount to the closed Hyperion basis and below every entitled listing in the set — is calibrated to its raw, pre-entitlement status.
The ask sits well below the entitled-land benchmark and above plain unimproved R3 dirt (±$110/lot SF ≈ $1.6M here) — the spread reflects the conceptual design package, the drawn density-bonus roadmap to 39 units, and the interim income from the existing 6-unit building.
| $/Lot SF | Implied Price | Per Conceptual Unit |
|---|---|---|
| $135 — conservative | $2,015,000 | $51,700 |
| $167 — base | $2,500,000 | $64,100 |
| $185 — upside | $2,760,000 | $70,800 |
The band runs from plain-dirt-plus pricing at the bottom to a level still ±21% below the entitled Hyperion benchmark at the top. Where the subject clears inside the band turns on how much credit a buyer gives the conceptual package and the density-bonus path — and on the distressed backdrop in Section 05.
Industry-range estimate for a 39-unit, 4-story Type V-A residential building over a 2-level subterranean garage in LA — not a contractor bid. Each line should be reconciled to the Ownership's hard-cost budget and any GC pricing in due diligence. Subtotals are bolded.
Hard-cost line items reflect typical LA infill pricing for Type V-A wood-frame residential over a 2-level subterranean garage. The $347K/unit hard-cost figure assumes a buyer with competitive GC pricing and efficient excavation and design costs; each line should be reconciled to actual bids in due diligence. Soft costs, financing, and contingency are sized to industry norms and should be tightened against the Ownership's actual lender term sheet and consultant scopes.
What the finished project returns and earns as the land price moves, holding the ±$18.48M build budget constant. Yield-on-cost uses the ±$1.125M stabilized NOI (untrended, today's rents) and the ±$1.24M trended NOI (rents grown across the runway to 2029E delivery). Net profit and return on cost are measured at stabilization against a trended exit value of ±$23.57M (5.25% cap). Market stabilized caps for newer Eastside product run 5.00%–5.25%.
| Land Price | $ / Conceptual Unit (Land) | All-In Cost (Land + Build) | Untrended Yield-on-Cost | Trended Yield-on-Cost | Net Profit at Stabilization | Return on Cost |
|---|---|---|---|---|---|---|
| $2,000,000 | $51,300 | $20,480,000 | 5.5% | 6.0% | $3,091,000 | 15.1% |
| $2,250,000 | $57,700 | $20,730,000 | 5.4% | 6.0% | $2,841,000 | 13.7% |
| $2,500,000 (list) | $64,100 | $20,980,000 | 5.4% | 5.9% | $2,591,000 | 12.4% |
| $2,750,000 | $70,500 | $21,230,000 | 5.3% | 5.8% | $2,341,000 | 11.0% |
| $3,000,000 | $76,900 | $21,480,000 | 5.2% | 5.8% | $2,091,000 | 9.7% |
Yield-on-cost = stabilized NOI ÷ (land + ±$18.48M build cost). Untrended on the ±$1.125M NOI from Section 04; trended applies ±10% rent growth across the runway (±$1.24M NOI). Net profit at stabilization = trended stabilized value (±$1.24M NOI ÷ 5.25% cap = ±$23.57M) less all-in cost; return on cost = net profit ÷ all-in cost. On today's untrended rents the project is roughly break-even at list (±$0.45M created value); the margin is built by rent growth across the runway and by the land basis — the land, not the exit, is doing the underwriting work.
This valuation is an opinion of value, not an appraisal. It is built from the comparable data in Sections 04–06 and the labeled cost assumptions above. Recommended pricing should be finalized with the Ownership after review of current market conditions, the conceptual plan set, and buyer feedback.
| Property / Unit | Type | SF Used | Assumed Renovated TIC Exit | $/SF |
|---|---|---|---|---|
| 2126 W Branden St — 1,500 SF per title · three units, underwritten vacant | ||||
| Unit 1 | 1 BR / 1 BA | 500 | $450,000 | $900 |
| Unit 2 | 1 BR / 1 BA | 500 | $450,000 | $900 |
| Unit 3 | 1 BR / 1 BA | 500 | $450,000 | $900 |
| 2126 Subtotal | $1,350,000 | $900 | ||
| 2132 W Branden St — 1,733 SF per title · three units, underwritten vacant | ||||
| Front unit | 2 BR / 1 BA | 733 | $550,000 | $750 |
| Back unit 1 | 1 BR / 1 BA | 500 | $450,000 | $900 |
| Back unit 2 | 1 BR / 1 BA | 500 | $450,000 | $900 |
| 2132 Subtotal | $1,450,000 | $837 | ||
| COMBINED GROSS TIC SELLOUT — 6 units, 3,233 SF per title | $2,800,000 | $866 | ||
| Property / Unit | Type | SF Used | Assumed Renovated TIC Exit | $/SF |
|---|---|---|---|---|
| 2126 W Branden St — ±2,741 SF per footprint · three units, underwritten vacant | ||||
| Unit 1 | 1 BR / 1 BA | 864 | $600,000 | $694 |
| Unit 2 | 1 BR / 1 BA | 1,060 | $675,000 | $637 |
| Unit 3 | 1 BR / 1 BA | 817 | $575,000 | $704 |
| 2126 Subtotal | $1,850,000 | $675 | ||
| 2132 W Branden St — ±2,703 SF per footprint · three units, underwritten vacant | ||||
| Front unit | 2 BR / 1 BA | 1,189 | $800,000 | $673 |
| Back unit 1 | 1 BR / 1 BA | 905 | $625,000 | $691 |
| Back unit 2 | 1 BR / 1 BA | 609 | $500,000 | $821 |
| 2132 Subtotal | $1,925,000 | $712 | ||
| COMBINED GROSS TIC SELLOUT — 6 units, ±5,444 SF per footprint | $3,775,000 | $693 | ||
Best Case exits are anchored to the larger closed units: 3944½ Marathon (821 SF 1BR, $572,887) supports the 817–905 SF 1BRs; 1160 Madison (970 SF, $698,000) and 1151 New Hampshire (1,090 SF, $710,000) bracket the 1,060 SF unit and the 1,189 SF front 2BR, with the Hyperion sales ($789–$857/SF) marking the ceiling. The blended ±$693/SF sits below the comp-set average of ±$728/SF. This scenario is valid only if the footprint square footage verifies.
| Property / Unit | Type | SF Used | Assumed TIC Exit | $/SF |
|---|---|---|---|---|
| New construction — one detached two-story ADU per lot, sold as additional TIC interests | ||||
| 2126 W Branden St — new ADU | 2 BR / 1 BA · 2-story | 600 | $525,000 | $875 |
| 2136 W Branden St — new ADU (rear lot) | 3 BR / 2 BA · 2-story | 1,000 | $725,000 | $725 |
| Six renovated units — carried at Best Case values | $3,775,000 | $693 | ||
| COMBINED GROSS TIC SELLOUT — 8 units, ±7,044 SF | $5,025,000 | $713 | ||
ADU exits are anchored to the comp set with a new-construction premium over renovated vintage: the 600 SF 2+1 matches 2612 Marathon #1/4 (687 SF renovated, $525,000), and the 1,000 SF 3+2 sits between 1160 Madison / 1151 New Hampshire (970–1,090 SF renovated 2BRs, $698,000–$710,000) and the Hyperion ceiling with an extra bedroom. State ADU law allows detached ADUs on multifamily lots ministerially; the ADUs sell as additional TIC interests within each community. ADU permitting and construction extend the program to ±18 months.
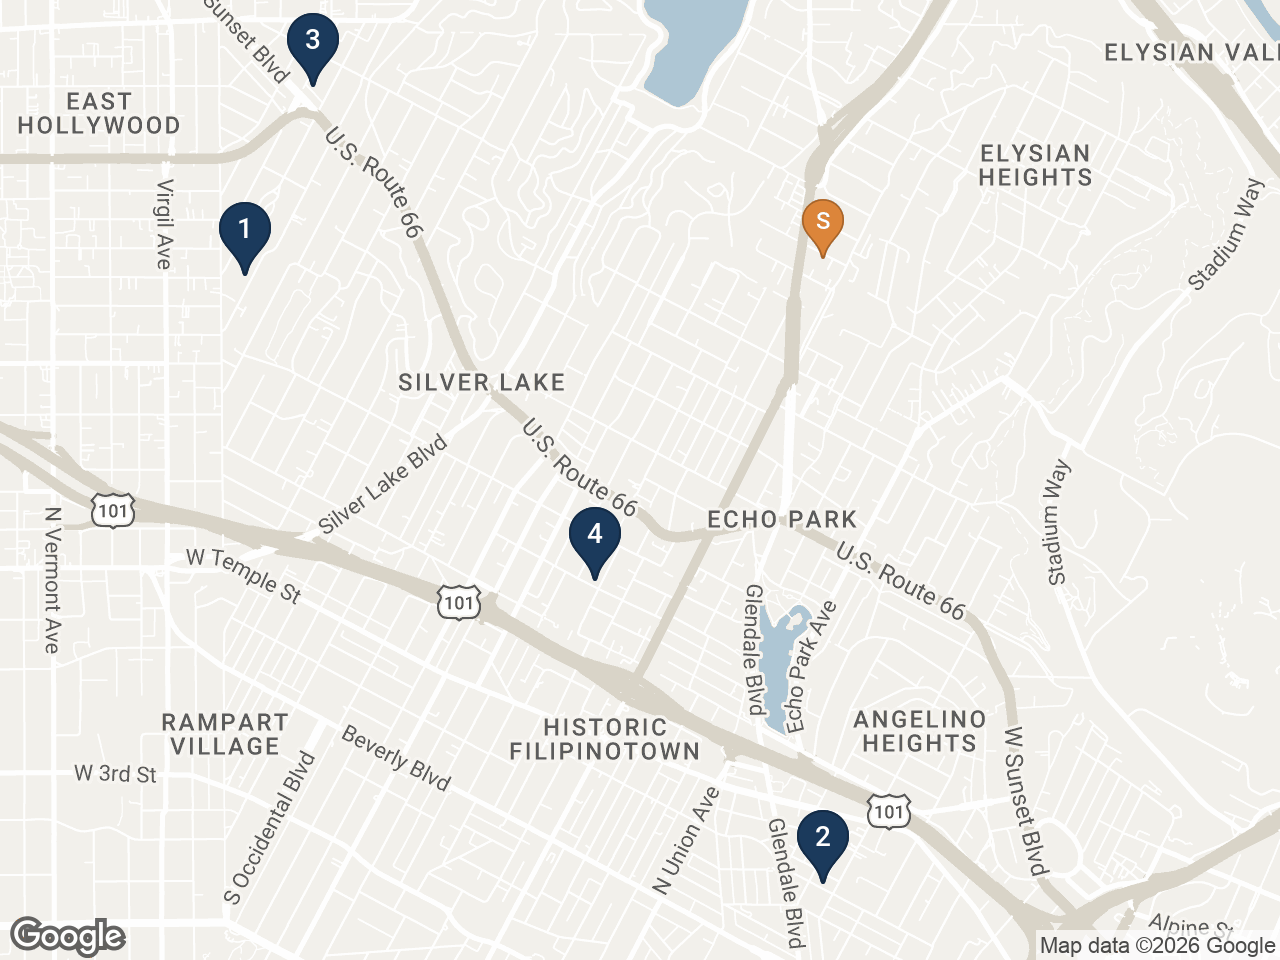
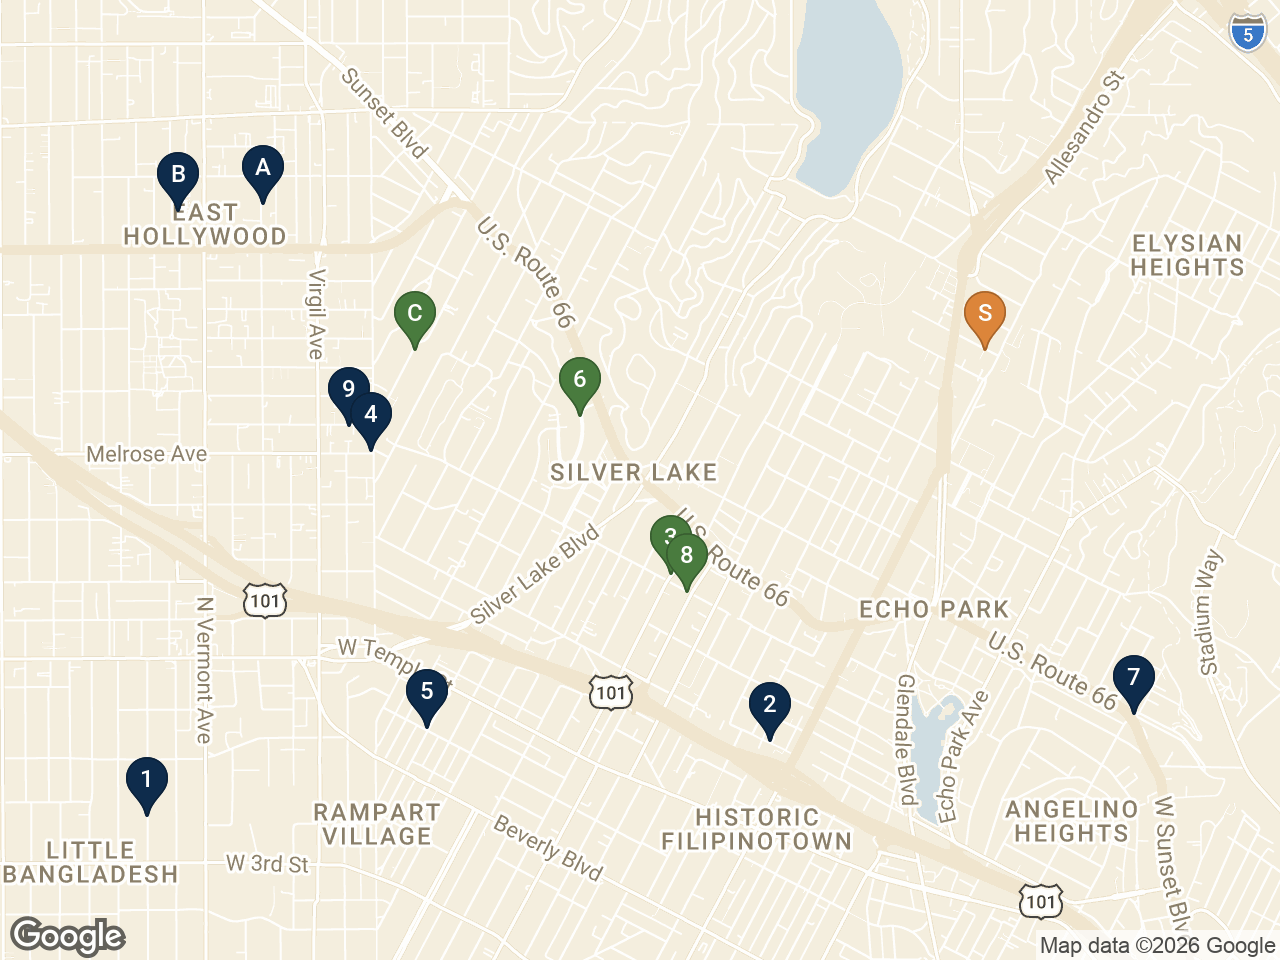
Fourteen closed TIC unit sales from August 2025 through July 2026, drawn from TheMLS. Every comp is a renovated unit in a small (2–12 unit) vintage building — the same product a TIC developer would create at Branden Street. The comp set contains closed sales only; no directly comparable renovated TIC inventory was on market in this pocket at the time of writing.
| Map | Address | Type | SF | Sold | Sold Price | $/SF | |
|---|---|---|---|---|---|---|---|
| Silver Lake — Closest Product Match (highlighted here and in green on the map) | |||||||
| 3 | 921 N Benton Way | Silver Lake | 2 BR / 2 BA | 660 | 6/25/26 | $415,000 | $629 |
| 6 | 3200 Larissa Dr | Silver Lake | 1 BR / 1 BA | 525 | 3/20/26 | $500,000 | $952 |
| 8 | 2612 Marathon St #1/4 | Silver Lake | 2 BR / 2 BA | 687 | 5/20/26 | $525,000 | $764 |
| 8 | 2612 Marathon St #1/2 | Silver Lake | 2 BR / 2 BA | 759 | 5/20/26 | $620,000 | $817 |
| C | 852 Hyperion Ave | Silver Lake | 2 BR / 1 BA | 980 | 6/26/26 | $840,000 | $857 |
| C | 854½ Hyperion Ave | Silver Lake | 2 BR / 1 BA | 1,102 | 12/12/25 | $870,000 | $789 |
| Broader Pocket — Echo Park / Virgil Village / East Hollywood / Historic Filipinotown / Koreatown | |||||||
| 1 | 211 S Berendo St #3 | Koreatown | 1 BR / 1 BA | 712 | 6/22/26 | $395,000 | $555 |
| 2 | 2135 Bellevue Ave #4 | Echo Park | 1 BR / 1 BA | 640 | 7/17/26 | $440,000 | $688 |
| 4 | 3903 Melrose Ave | Virgil Village | 1 BR / 1 BA | 570 | 10/1/25 | $500,000 | $877 |
| 5 | 3203½ W Council St | Historic Filipinotown | 2 BR / 1.5 BA | 960 | 7/29/26 | $515,000 | $536 |
| 7 | 1331 Lilac Ter | Echo Park | 1 BR / 1 BA | 656 | 8/13/25 | $500,000 | $762 |
| 9 | 3944½ Marathon St | Virgil Village | 1 BR / 1 BA | 821 | 9/22/25 | $572,887 | $698 |
| A | 1160 N Madison Ave | East Hollywood | 2 BR / 1 BA | 970 | 1/9/26 | $698,000 | $720 |
| B | 1151 N New Hampshire Ave | East Hollywood | 2 BR / 2 BA | 1,090 | 8/15/25 | $710,000 | $651 |
Source: TheMLS closed-sale records (VestaPLUS), pulled August 2026; sold prices and square footage as reported by the listing brokers, not independently verified. Blended comp average ±$728/SF across 11,132 SF; median sale $520,000. The six Silver Lake sales — the closest product match to the subject — blend to ±$800/SF. Small 1BRs (525–656 SF) in Echo Park / Silver Lake cleared $440,000–$500,000; the Base Case carries the subject 1BRs at $450,000 and the 733 SF 2BR at $550,000 — inside, and below the top of, the closed range.
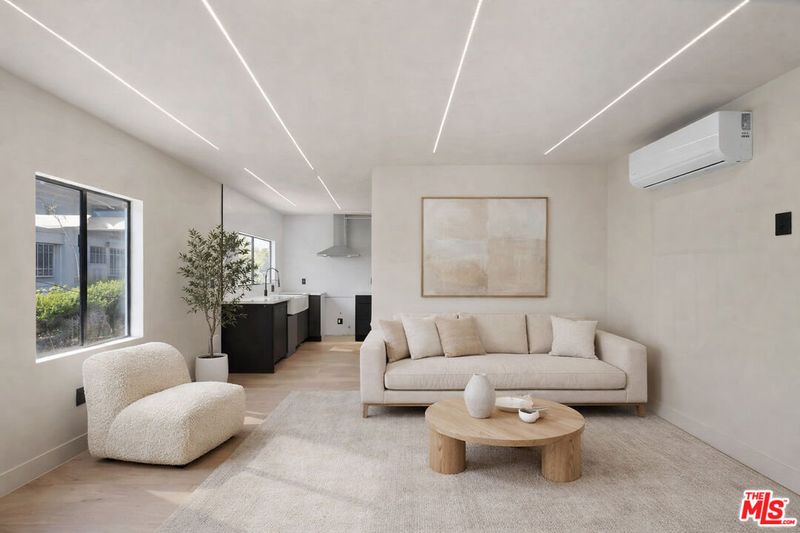
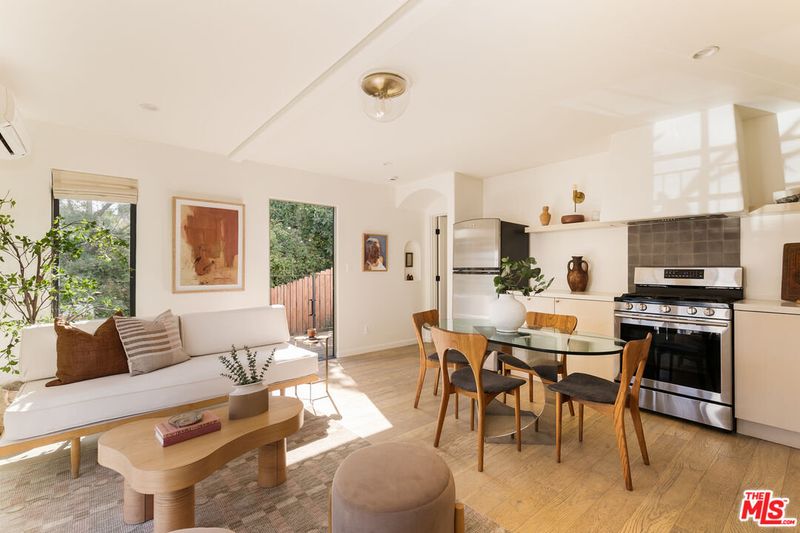
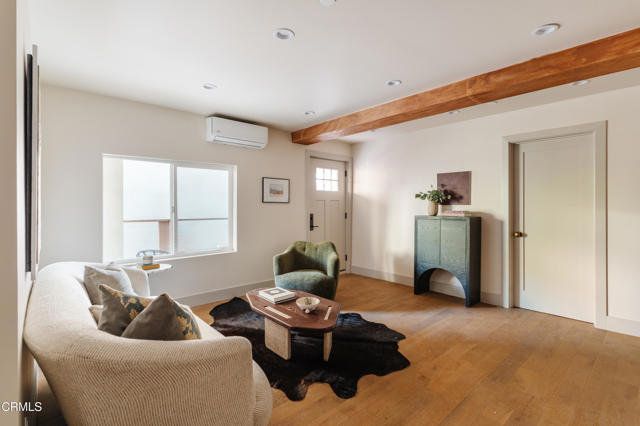
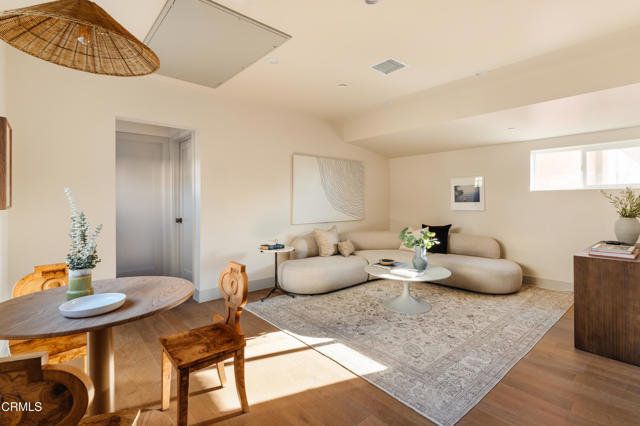
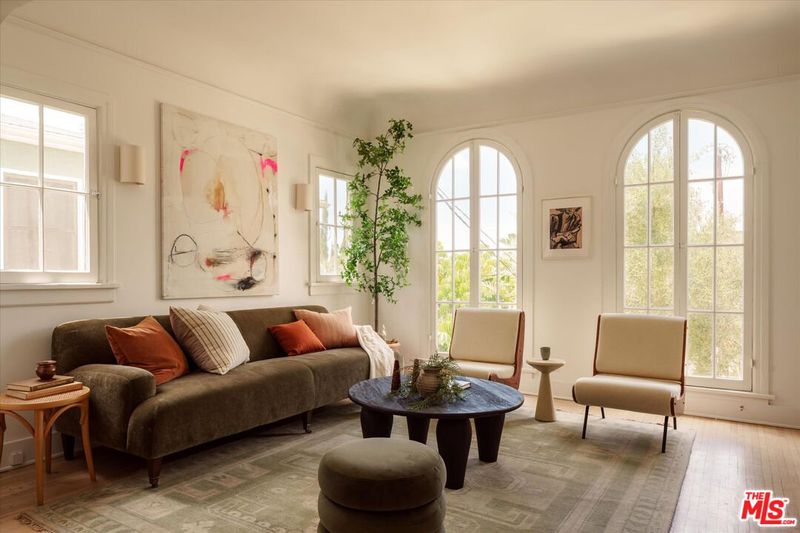
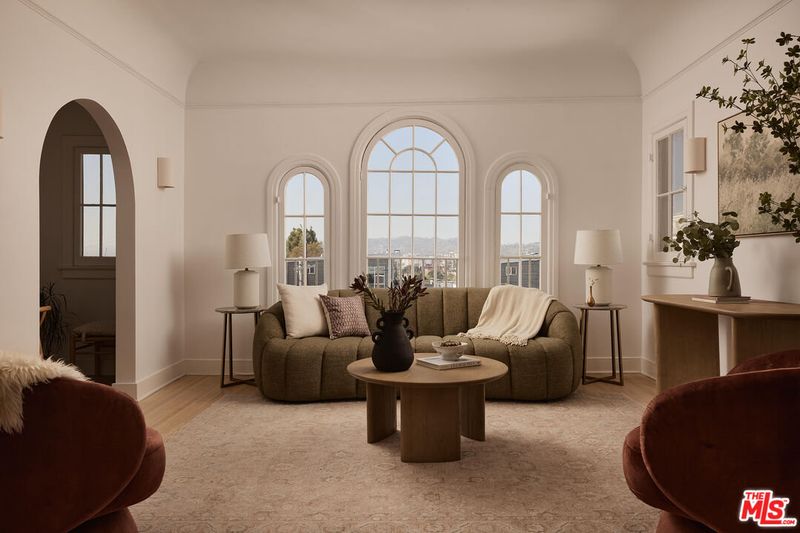
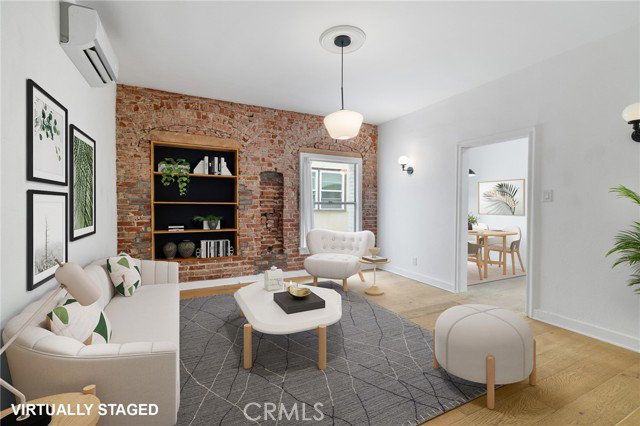
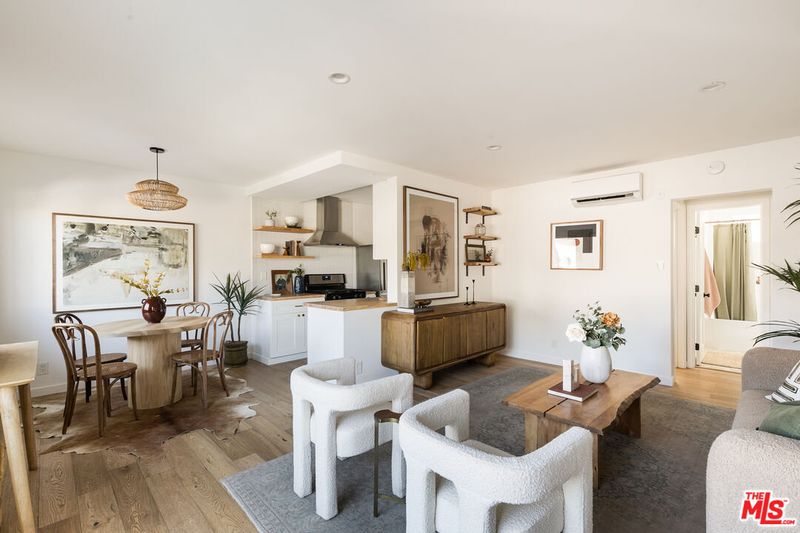
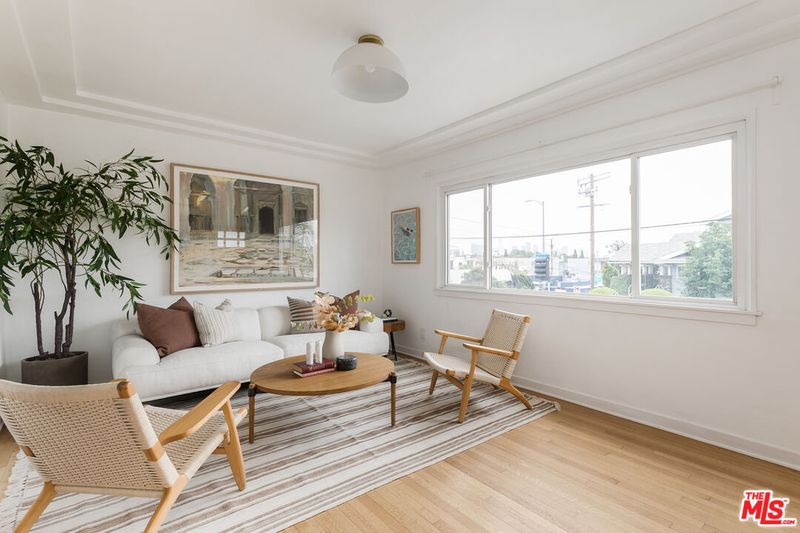
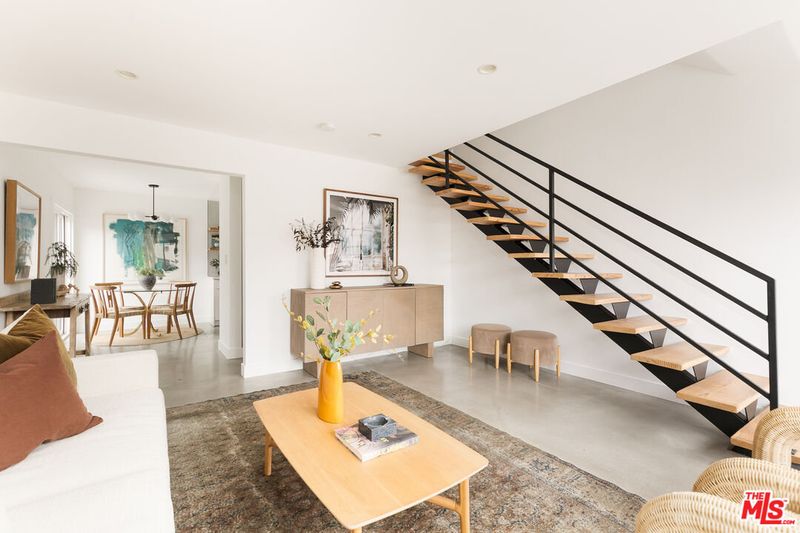
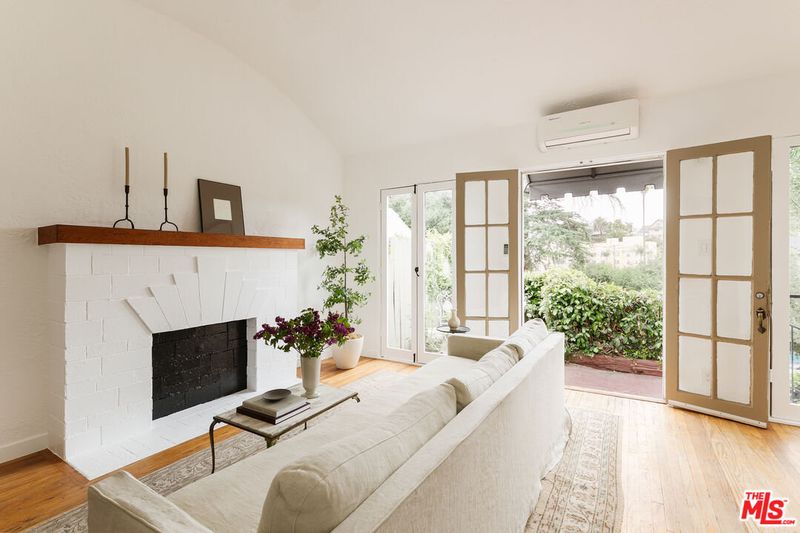
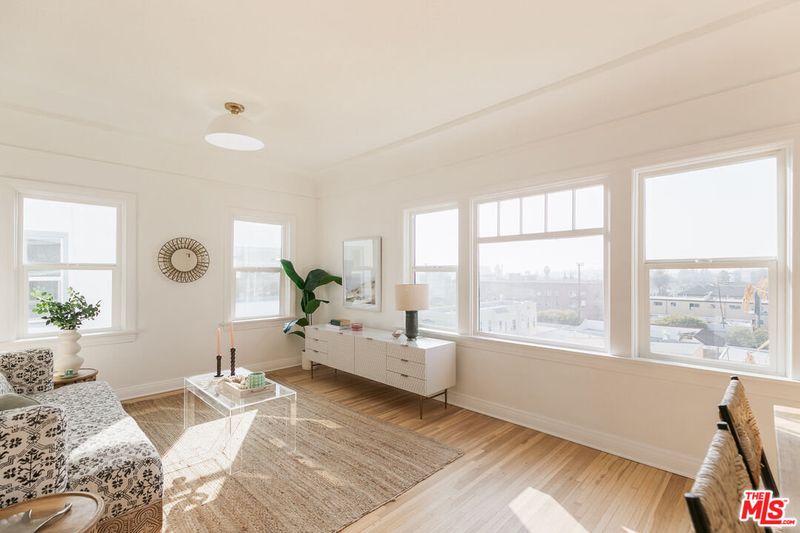
Photos: TheMLS listing photography for each closed sale, reproduced from the comp records; some images are digitally staged per the listing remarks.
What a TIC developer can pay today, solving backward from each scenario's gross sellout: renovation to the comp-set standard, ADU construction where applicable, TIC formation, selling costs, carry, and a market development margin. The Base Case is underwritten to title square footage; the Best Case and Best Best Case apply only if the larger footprint square footage verifies.
Allocation is proportional to each property's share of gross sellout. Renovation reflects the full kitchen/bath/systems scope visible in the comp set, stepped up to $100,000/unit in the Best and Best Best Cases for the larger interiors; ADU construction is carried at $400,000 (1,000 SF 3+2) and $250,000 (600 SF 2+1) all-in. TIC exits require no condo conversion or DRE public report, and comp-set financing was offered at 10%–15% down through fractional lenders.
The challenge. LA hard-construction costs are elevated and have been volatile. Type V-A wood-frame over a two-level subterranean concrete garage is a cost-heavy configuration, and a 4-story project carries meaningful steel, concrete, insurance, and labor exposure.
How this deal answers it. Cost is the single biggest swing variable, and this BOV labels it as an assumption to be re-run against the buyer's own GC pricing. Two structural mitigants: the plan is still conceptual, so a buyer can value-engineer before a single sheet is submitted; and under AB 2097 no parking is required — the two subterranean levels in the concept can be shrunk or cut entirely, stripping out the most expensive part of the budget. Pricing is set to leave room for the buyer's hard-cost reality.
The challenge. Construction financing is expensive, underwriting is tight, and merchant-build profit margins are compressed versus the last cycle.
How this deal answers it. The site trades at a low absolute basis (±$2.5M), so the capital stack is anchored by a modest land number a buyer can carry without construction debt while entitling. The existing 6-unit building's income offsets part of that carry — and the buyer chooses when to start the capital clock, rather than inheriting someone else's basis and timeline.
The challenge. The density bonus would be unlocked by a recorded affordability covenant; the income-restricted units rent well below market.
How this deal answers it. The covenant is the very thing that would unlock the 39-unit density — a trade developers make willingly. The restricted units are already netted out of the rental NOI in this BOV; the concept pencils after that haircut, not before it.
The challenge. Six rent-stabilized units occupy the site today and must be cleared, triggering tenant-relocation cost and process before construction.
How this deal answers it. Relocation is a known, budgetable item and is carried inside the development-cost estimate. Until construction, the existing 6-unit building produces interim holding income that offsets carry through entitlement and financing — a rare offset on a land deal.
The challenge. This is raw land. The buyer runs its own entitlement — application, fees, affordability covenant, plan check — before a shovel touches dirt, and carries the site through that runway.
How this deal answers it. Stated plainly throughout this BOV. The mitigant is the kind of entitlement: the State Density Bonus is a state-law program with objective, non-discretionary incentives — not a rezone or a variance fight — and the conceptual plan set is already drawn to that framework. Interim RSO income offsets carry while the buyer works the process at its own pace and design.
The challenge. A project on this site delivers in roughly three to four years, into a rental market no one can forecast with certainty — and Section 05 shows new product in this pocket trading at deep discounts today.
How this deal answers it. The land basis is the hedge. At ±$64,100 per conceptual unit, the buyer is paying for dirt near the bottom of the cycle — not for someone else's finished-product assumptions. Echo Park is structurally supply-constrained, the newer-construction comps in Section 04 are leasing now, and the current distress is cyclical: the same constraint that makes the pocket hard to build in is what fills its buildings. Underwriting is held at conservative-to-mid assumptions, not peak-of-cycle ones.
The State Density Bonus — a state-law program with objective incentives — carries the site to a conceptual 39 units, and the concept is already drawn to that framework.
±$167 per lot SF and ±$64,100 per conceptual unit — a ±29% discount to the pocket's entitled-land benchmark, priced for the bottom of the cycle.
The Molai Land & Design conceptual plan set — massing, unit schedules, parking layout, density-bonus calculations — gives a buyer a running start on its own application.
Six newer-construction buildings within blocks — Zag, Encore, Inspire, OnSunset, Echo 55 and 1915 Park — have leased up at strong rents, de-risking the rental underwriting with real market evidence.
The land basis is sized so a future project pencils even against the $300K–$364K/door distressed trades around the corner — a buyer at this number is buying the cycle, not fighting it.
An existing 6-unit RSO building generates holding income through entitlement and financing — a rare carry offset on a raw-land deal.
2126–2136 Branden is marketed to Los Angeles land buyers and density-bonus developers who want a low-basis Echo Park canvas with the thinking already done. The piece a buyer is acquiring — a 14,928 SF R3 double lot with a conceptual plan for 39 units, interim RSO income, and a marked state-law path to density — is priced for the bottom of the cycle in a structurally supply-constrained submarket. The recommended guidance of $2,500,000 is set to drive competitive tension while leaving the conceptual package and the entitled-land benchmark to be argued for in escrow.